Arctic 2006
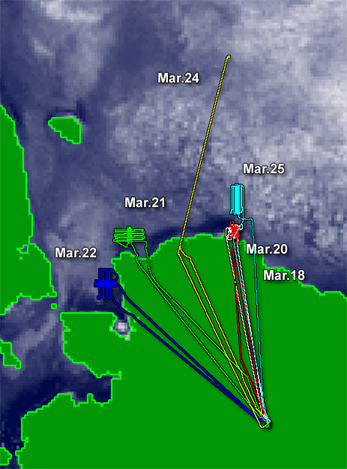
Six successful flights with the NASA P-3B aircraft over the Alaskan Arctic were conducted between March 18 and March 25, 2006. The prime objective was to validate and evaluate AMSR-E snow depth on sea ice retrievals. A secondary objective was to underfly ICESat to assess the impact of snow on ICESat ice thickness retrievals. The NASA aircraft was equipped with four primary instruments:
- A microwave radiometer (A. Gasiewski, U. Colorado) with frequencies similar to AMSR-E
- A snow radar (S.P. Gogineni, U. Kansas), which can directly measure the snow depth on sea ice
- A radar altimeter (C. Leuschen, JHU APL), which measures the height of the sea ice
- A laser altimeter (W. Krabill, GSFC Wallops), which measures the height of the snow.Validation was done in a two-step upscaling process: In-situ measurements of snow and sea ice were carried out over the Arctic Ocean adjacent to Barrow, AK, (PIs: M. Sturm, CRREL, and J. Maslanik, U. Colorado) and their measurements were overflown in order to validate the aircraft instruments. Patterns over the Arctic Ocean corresponding to 4x8 12.5 km AMSR-E pixels were flown for direct comparison with the AMSR-E snow depth retrievals. The success of the campaign resulted from the lessons learned from our 2003 Arctic campaign and the close coordination among the PIs, the instrument scientists, the aircraft managers and crew, and the scientists on the ground at Barrow. The fact that the aircraft and sensors all performed well played no small part.
Press Coverage: In addition to a NASA press release and several scientific websites the campaign was covered by cnn, abc news, and msnbc and other news organizations.
Flight 1, March 18:
Barrow area to validate aircraft instruments and to test the snow radar and determine its optimum operating altitudeFlight 2, March 20:
2nd Barrow flight to validate the snow radar and to develop a coordinated in-situ, laser/radar altimeter, and snow radar snow depth data sets.Flight 3, March 21:
Beaufort Sea area for direct AMSR-E comparison over mostly shallow snowFlight 4, March 22:
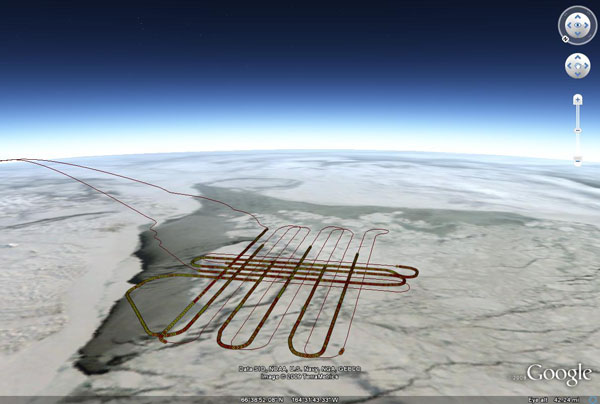
Chukchi Sea area for direct AMSR-E comparison over mostly deep snowFlight 5, March 24:
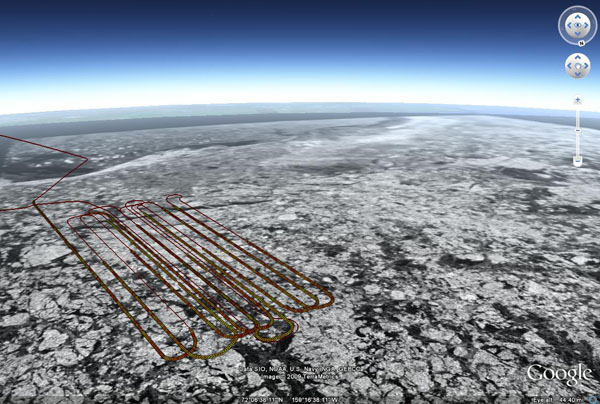
Chukchi Sea flight track underneath ICESat orbitFlight 6, March 25:
Beaufort Sea area for direct AMSR-E comparison over a mixture of first-year and multiyear ice
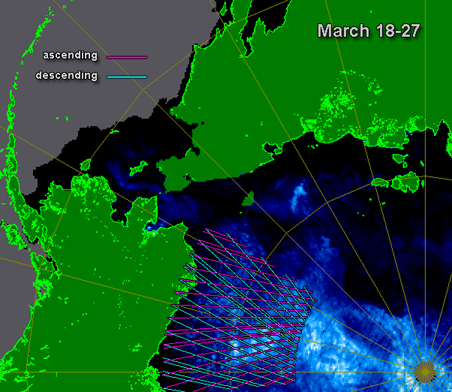
ICESat tracks over Arctic2006 study region


Arctic 2006 - Google Earth Files
arctic2006_mar18.kmz flight path and surface roughness arctic2006_mar20.kmz " arctic2006_mar21.kmz " arctic2006_mar22.kmz " arctic2006_mar24.kmz " arctic2006_mar25.kmz " arctic2006_jh_photos.kmz (72 MB) John Heinrich's field photos arctic2006_barrow.kmz Barrow survey lines arctic2006_barrow_map.zip (26 MB)** Barrow map arctic2006_modis_radarsat.zip (126 MB)** MODIS and RADARSAT images arctic2006_google_earth.zip (198 MB)** all of the above in one file - kmz files can be opened with Google Earth (or right click and save as to open locally)
** the zip files must be downloaded and unzipped. This will create a folder with multiple kml files. The main kml file that should be opened with Google Earth is the one with the same name as the folder.
Image Gallery
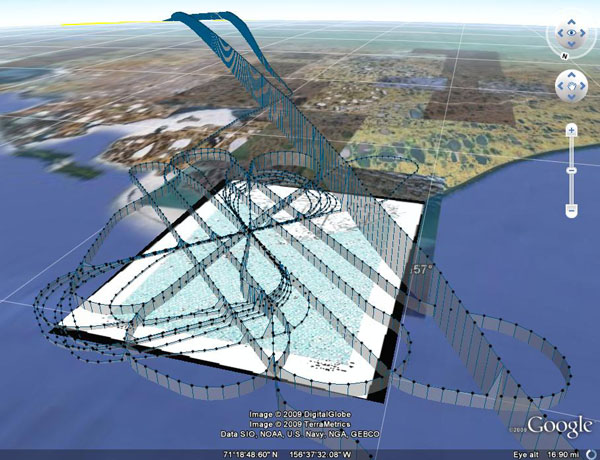
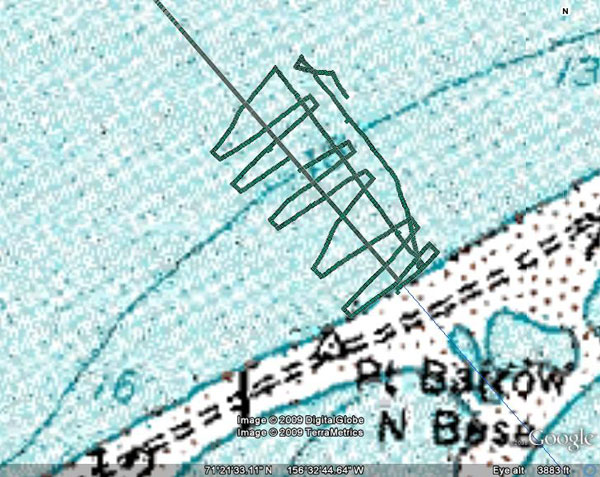
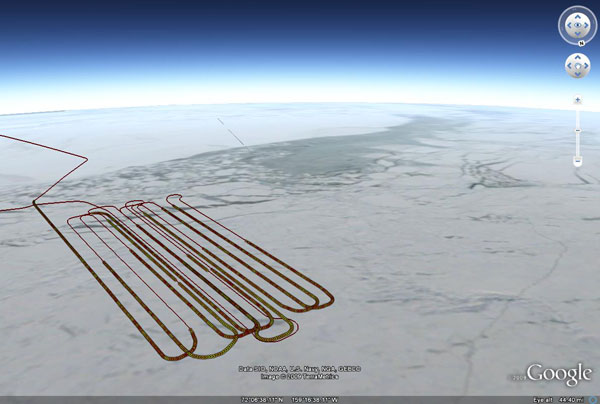
March 20 flight over Barrow
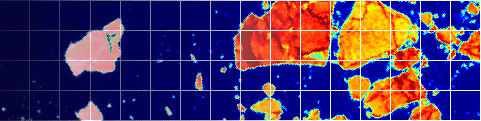
March 22 flight shown over MODIS background. Aerial photo derived urface roughness data (yellow to red) is displayed along the flight path.
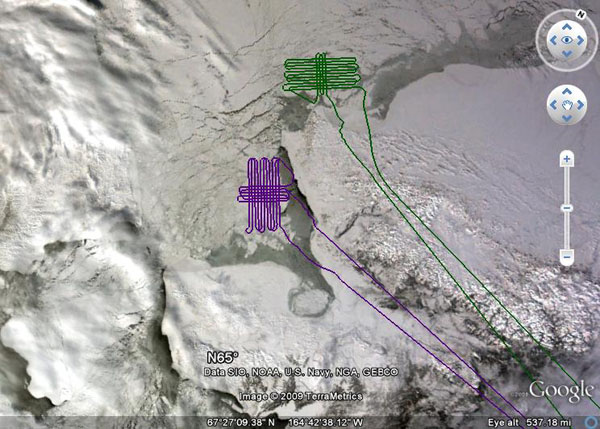
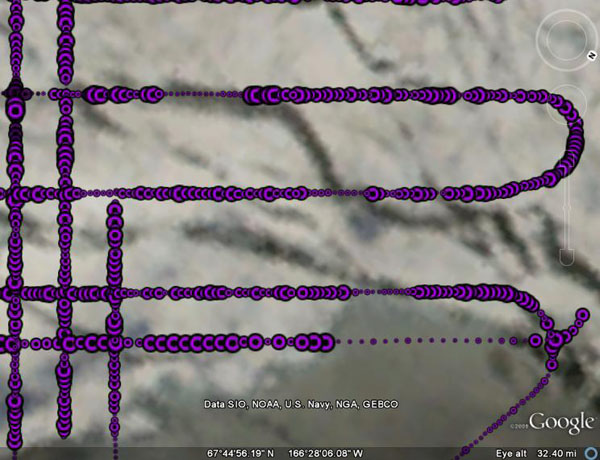
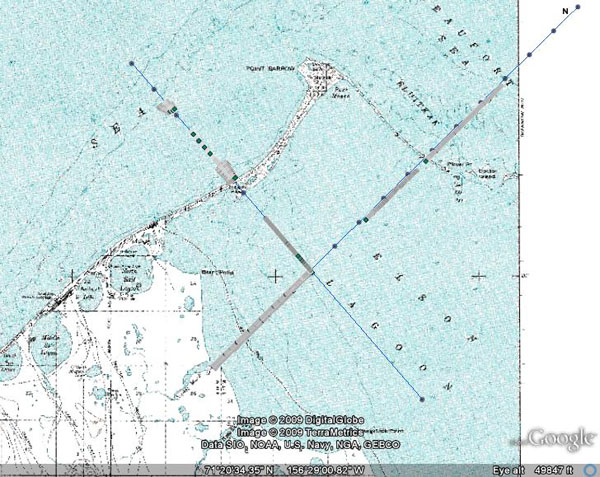
March 21 (green) and March 22 (magenta) shown over a MODIS background
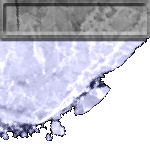
Surface roughness along the flight path
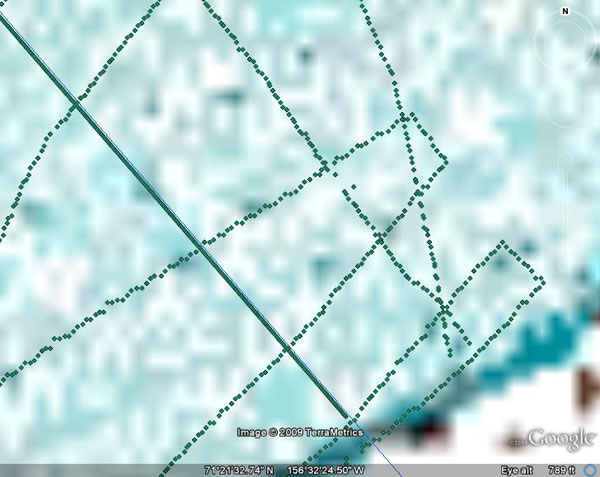
Field snow depth measurements (grey) along the Barrow survey lines
... zoomed in
... zoomed in further until individual field measurements are seen (~every 1m)
March 25 flight path and data shown over RADARSAT data
... the same view shown with the corresponding MODIS data
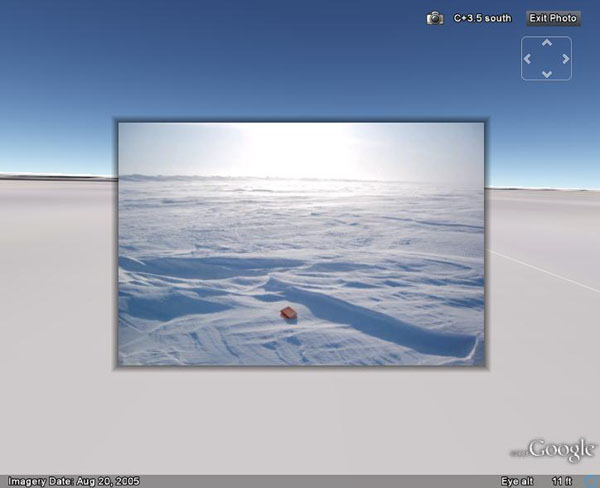
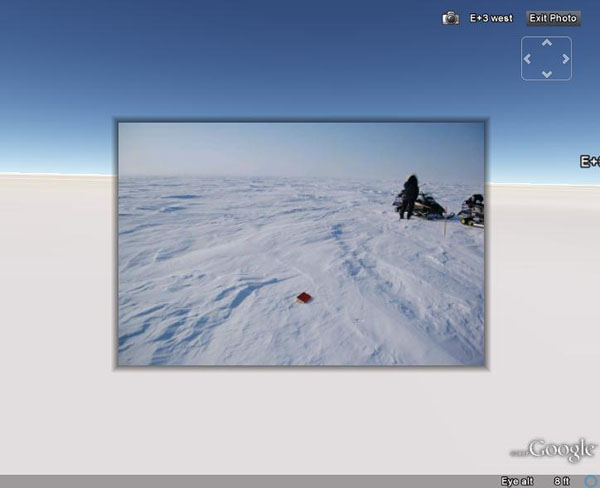
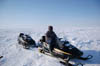
Field photographs taken by John Heinrich at each of the main survey points, and in each of the four compass directions, north, east, west and south. These are displayed in Google Earth 3D from the same vantage point as the original photograph.
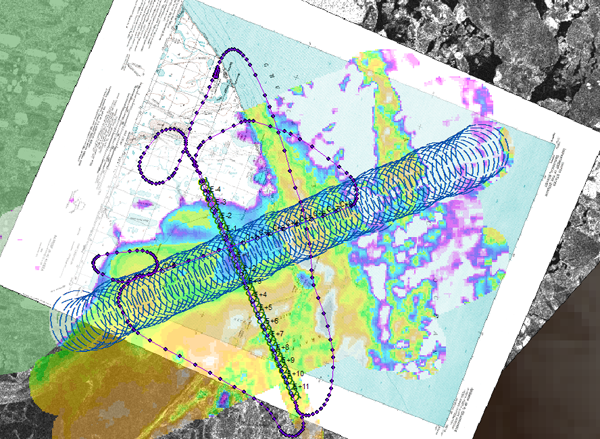
ArcGIS workspace showing the Barrow Map over SAR data, along with some PSR conical scan lines and the the resulting PSR data gridded over the region. Also shown is the flight path of the Cessna aircraft used in the campaign
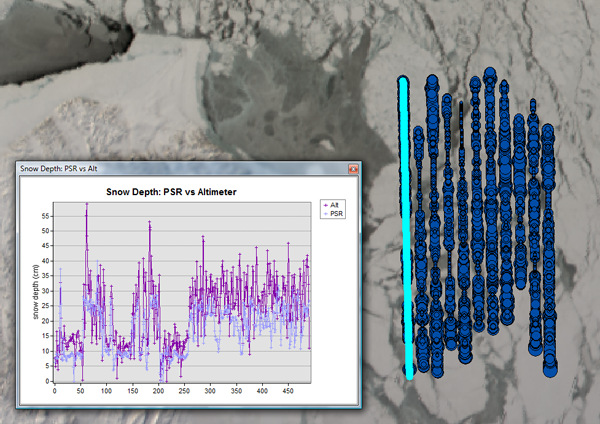
March 21 Snow Depth Comparison: Polarimetric Scanning Radiometer (PSR) vs Altimeter. The altimeter based snow depth is derived from the ATM - D2P data. The ATM (Airborne Topographic Mapper) is a Lidar instrument which measures the height of the snow surface, while the D2P (delay/Doppler phase-monopulse) is a radar altimeter which penetrates the snow and measure the height of the sea ice surface.
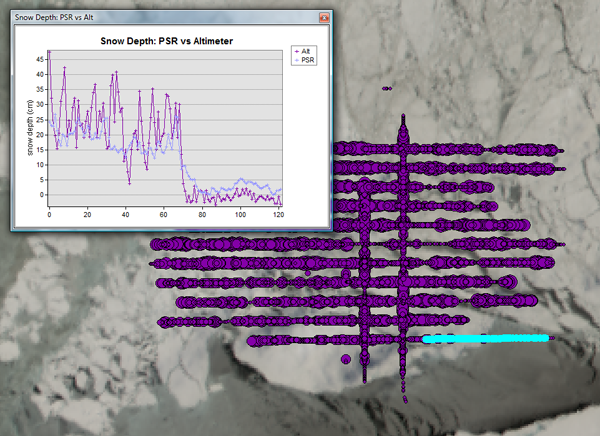
March 22 Snow Depth Comparison
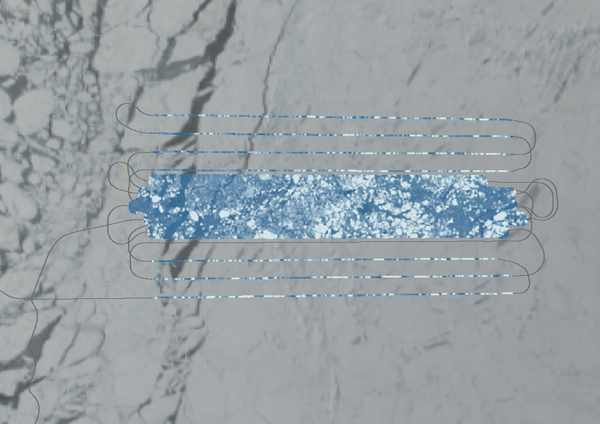
The PSR 37v channel gridded over MODIS data for the March 25 flight. Stare mode scans were used along the flight track. The transects in the middle are higher altitude conical scans resulting in greater coverage.
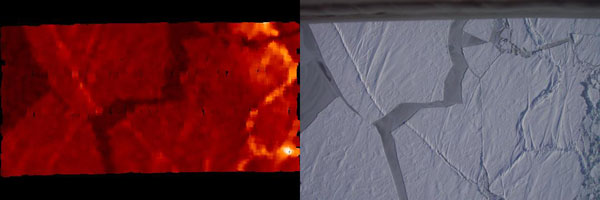
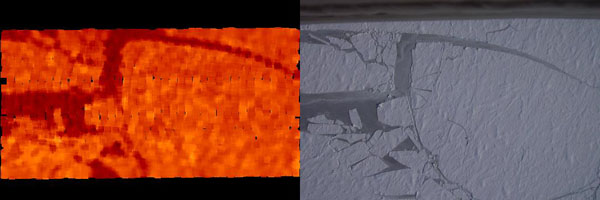
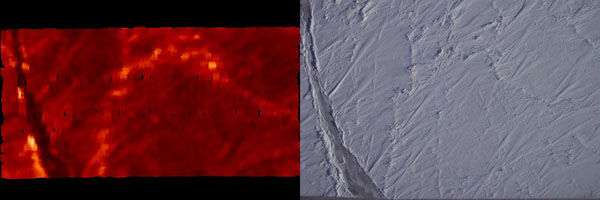
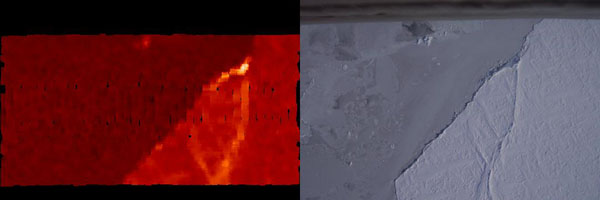
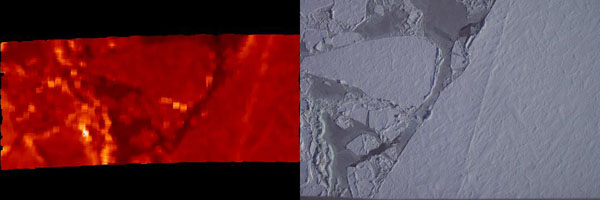
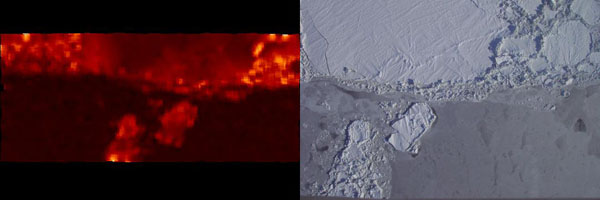
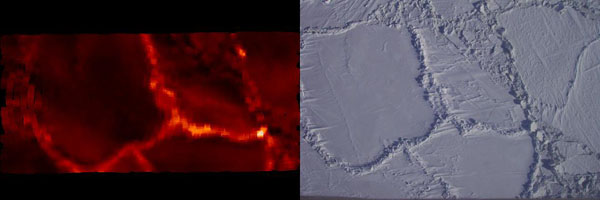
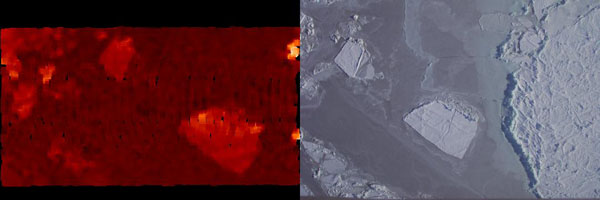
ATM (Airborne Topographic Mapper) LIDAR data, side by side with the corresponding aerial photos, both taken along the flight track.
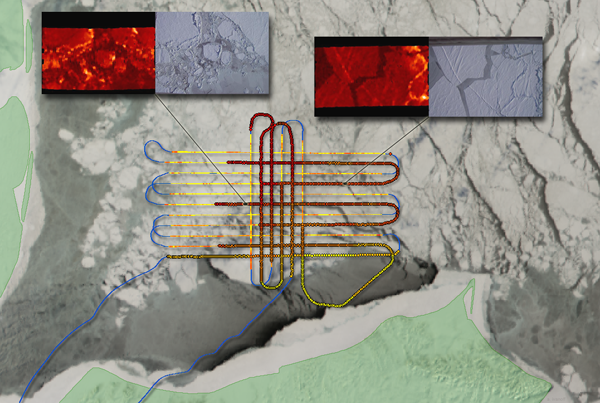
March 22 flight path showing data points color coded according to AMSR snow depth (yellow to red), over a true color MODIS image. The insets show two examples of the ATM (Airborne Topographic Mapper) LIDAR data, side by side with the corresponding aerial photos taken during of the flights.