Meltpond2000
Meltpond2000 is the first in a series of Arctic and Antarctic aircraft campaigns planned as part of NASA's Earth Observing System (EOS) Aqua sea ice validation program for the EOS Advanced Microwave Scanning Radiometer (AMSR-E). This prelaunch Arctic field campaign was carried out between June 25 and July 6, 2000 from Thule, Greenland with the objective of quantifying the errors incurred by the AMSR-E sea ice algorithms resulting from the presence of melt ponds. A secondary objective of the mission was to develop a microwave capability to discriminate between melt ponds and seawater using low-frequency microwave radiometers. Meltpond2000 was a multiagency effort involving personnel from the Navy, NOAA, and NASA. The field component of the mission consisted of making five 8-hour flights from Thule Air Base, Greenland with a Naval Air Warfare Center P-3 aircraft over portions of Baffin Bay and the Canadian Arctic. The aircraft sensors were provided and operated by the Microwave Radiometry Group of NOAA's Environmental Technology Laboratory. A Navy ice observer with the National Ice Center provided visual documentation of surface ice conditions during each of the flights. Two of the five flights were coordinated with Canadian scientists making surface measurements of melt ponds at an ice camp located near Resolute Bay, Canada. Coordination with the Canadians will provide additional information on surface characteristics and will be of great value in the interpretation of the aircraft and high-resolution satellite data sets. (click here to go back to projects page)
3D Fly-Through Animations
(To download: right click -> Save as)
A Multi-Sensor View of the Baffin Bay Flight Region (3 min 35 sec)
Full Size 1280x720 **- AVI Hi-Res 1280x720 (77 MB)
Half Size- AVI (44 MB)
- Quicktime (138 MB)
- MPEG (30 MB)
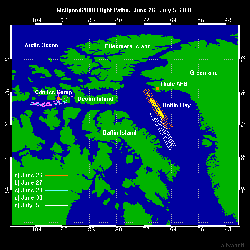
Arctic Sea Ice Concentration, June 27 2000 (2 min 35 sec) These animations show data from various satellite and aircraft sensors (SSMI, AVHRR, Landsat, MODIS, NOAA Polarimetric Scanning Radiometer) on June 27, 2000 along with digital elevation and bathymetric data for the Baffin Bay area of the Meltpond2000 flights.
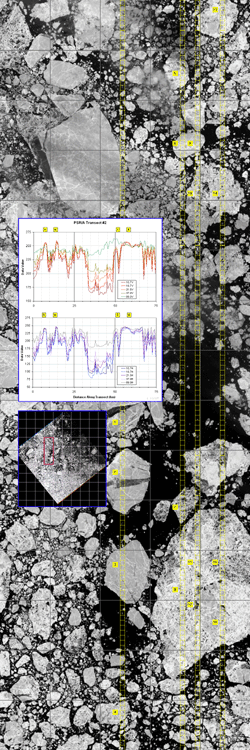
The SSMI Sea Ice Concentration was derived from SSMI brightness temperatures (obtained from NSIDC) using the NASA Team sea ice algoritm. The AVHRR data was obtained from NOAA's Satellite Active Archive as swath data. The Landsat scenes were purchased from the USGS. The PSR instrument data was obtained during the Meltpond2000 expedition. The MODIS data was obtained through the EOS Data Gateway.
The elevation data is from the USGS GTOPO30 global digital elevation model. This was combined with bathymetric data from NOAA to form the 3D elevation grid over which the other data sets were draped.
Each of the data sets initially had a different resolution and projection.
Data Set Resolution Projection SSMI 25 km polar stereographic AVHRR 1 km swath MODIS 500 m swath Landsat 30 m polar stereographic NOAA PSR 0.5 - 1 km swath USGS GTOPO30 DEM 30 arcsecond (~ 1km) lat-lon Bathymetry 2.5 km polar stereographic These were reprojected and regridded onto a common 500 m polar stereographic grid.
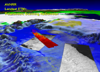
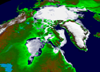
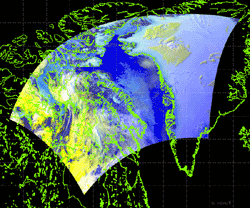
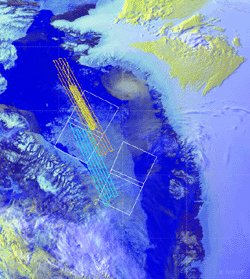
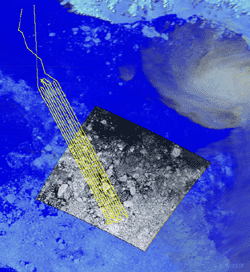
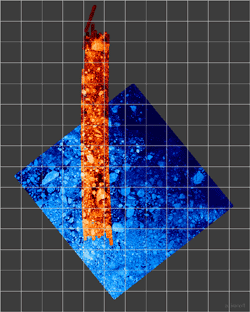
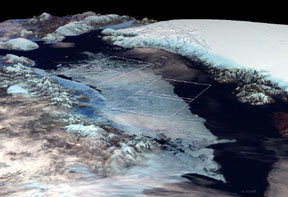
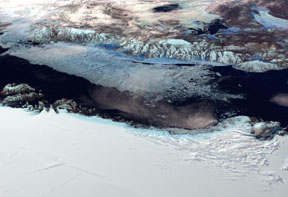
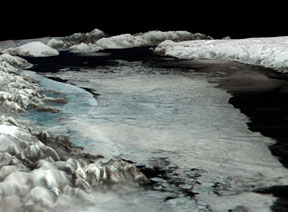
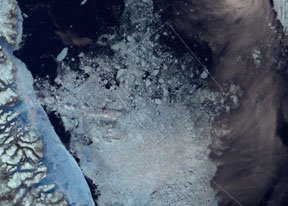
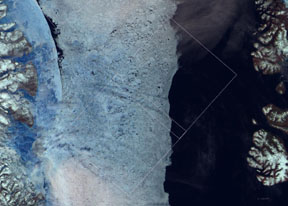
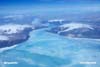
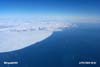
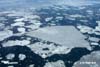
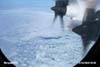
Images
(click on images to view the larger versions)
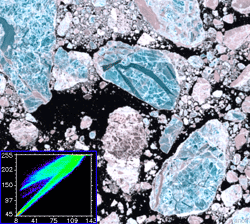
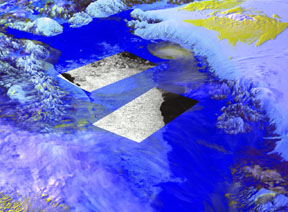
These are a few frames from the 3D fly-through animations showing the Meltpond2000 location with digital elevation data along with the AVHRR, Landsat and MODIS satellite data.